![]() I like this
I like this
Nice work on this, this looks super cool.
1 Like
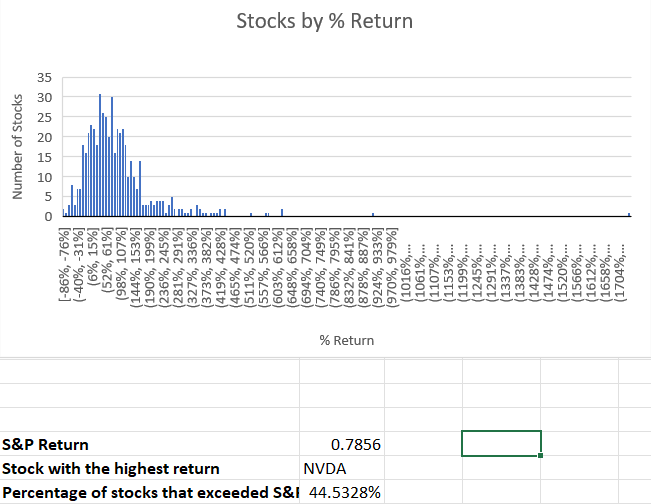
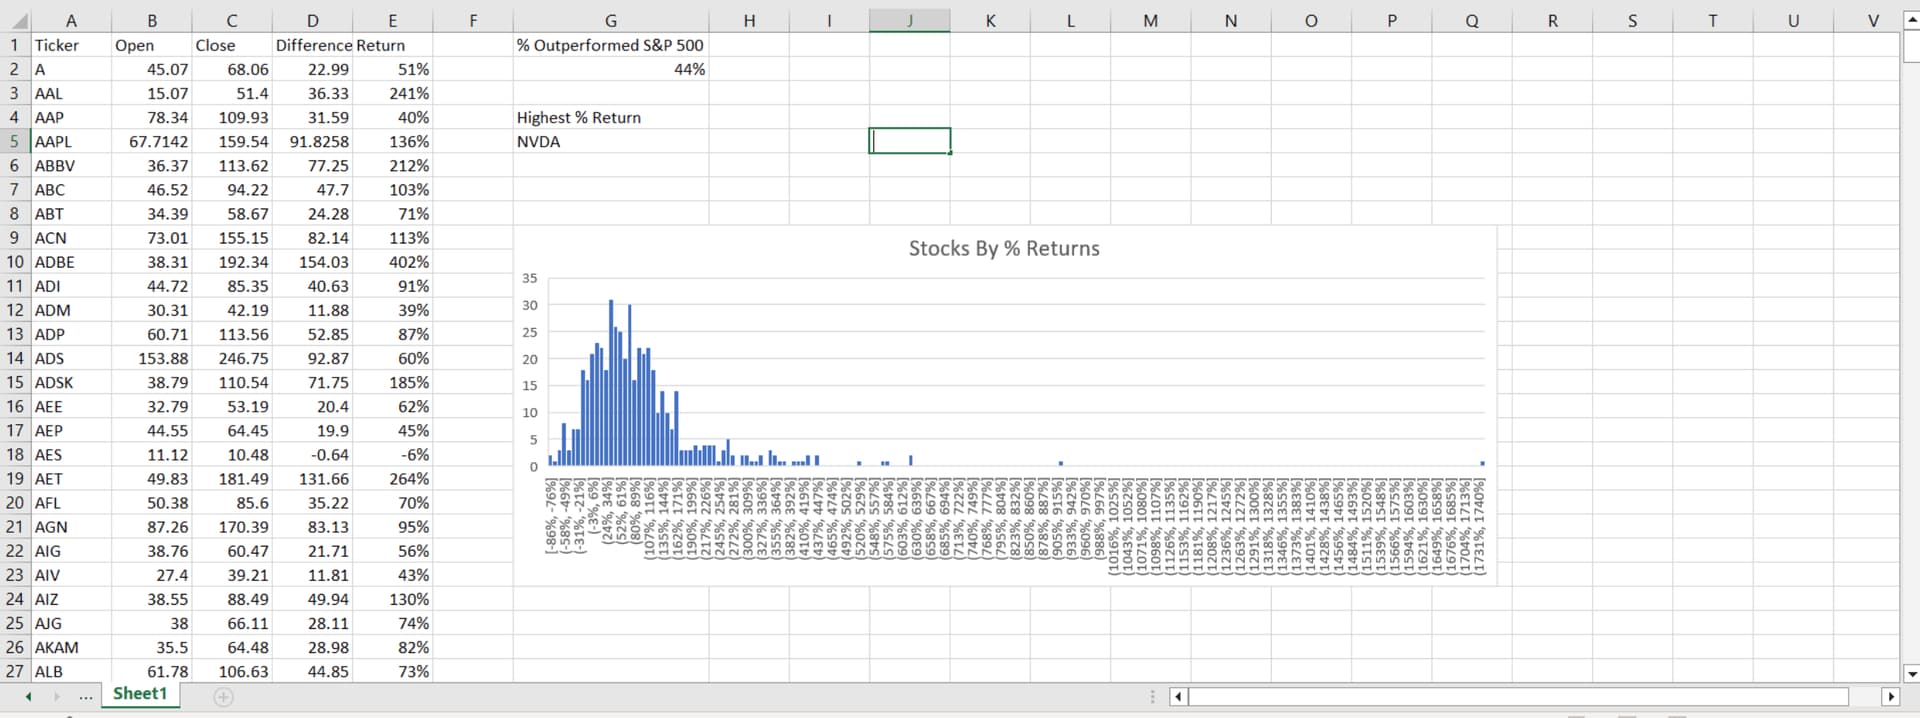
Finding a solution to this problem required me to use a fair amount of the XLOOKUP function, the COUNTIFS function, and references to a separate worksheet. It was also a great practice with implementing graphs in Excel.
1 Like
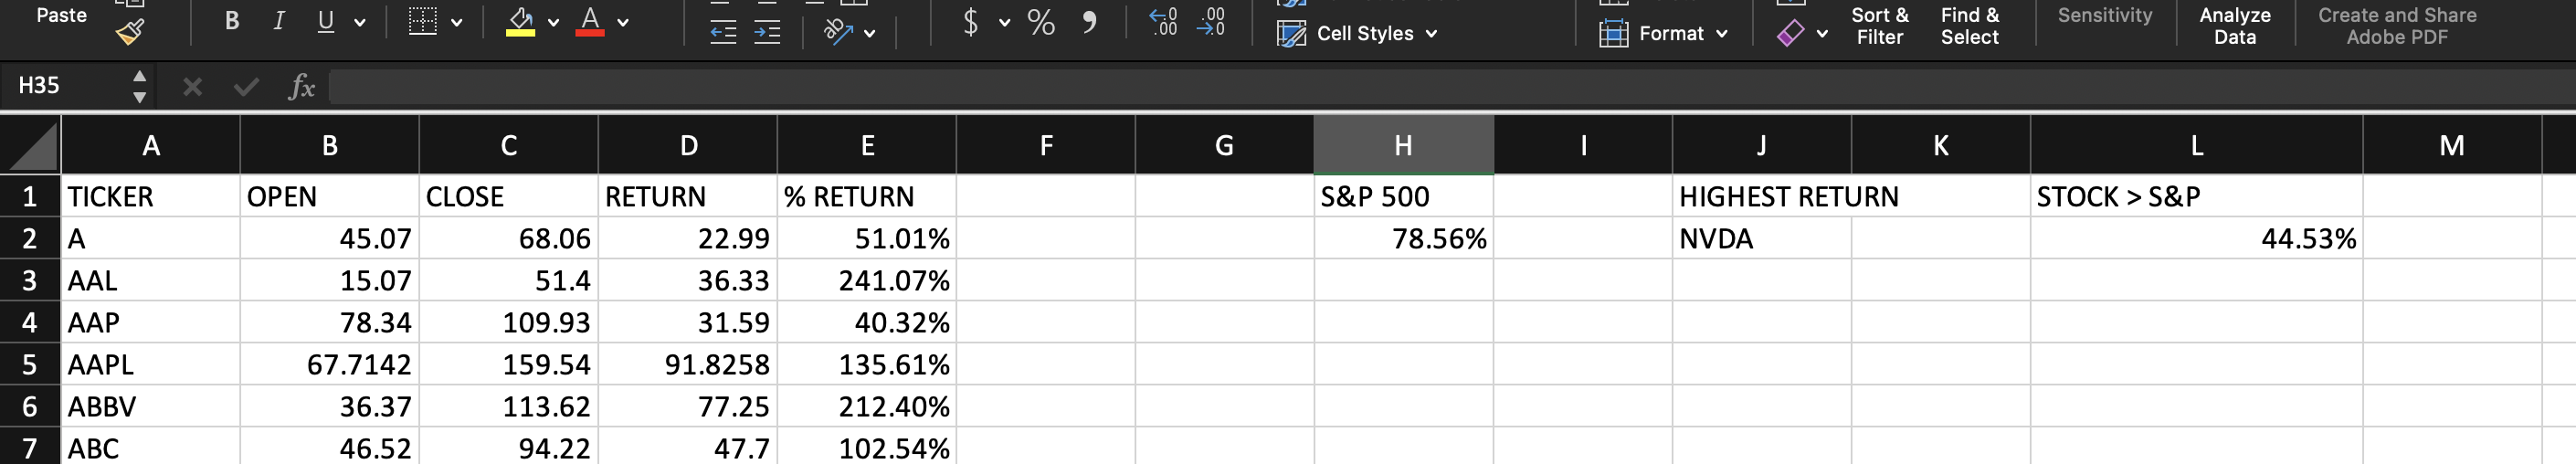
I definitely agree, XLOOKUP is amazing! It seems like all of the problems I’ve chosen on TechHub were solved using XLOOKUP. Before the semester, I didn’t have much experience, but I feel like I have a good grasp of it after all these repetitions.
Here is what I got for my solution. I still need to figure out how to customize the chart design/format.
1 Like
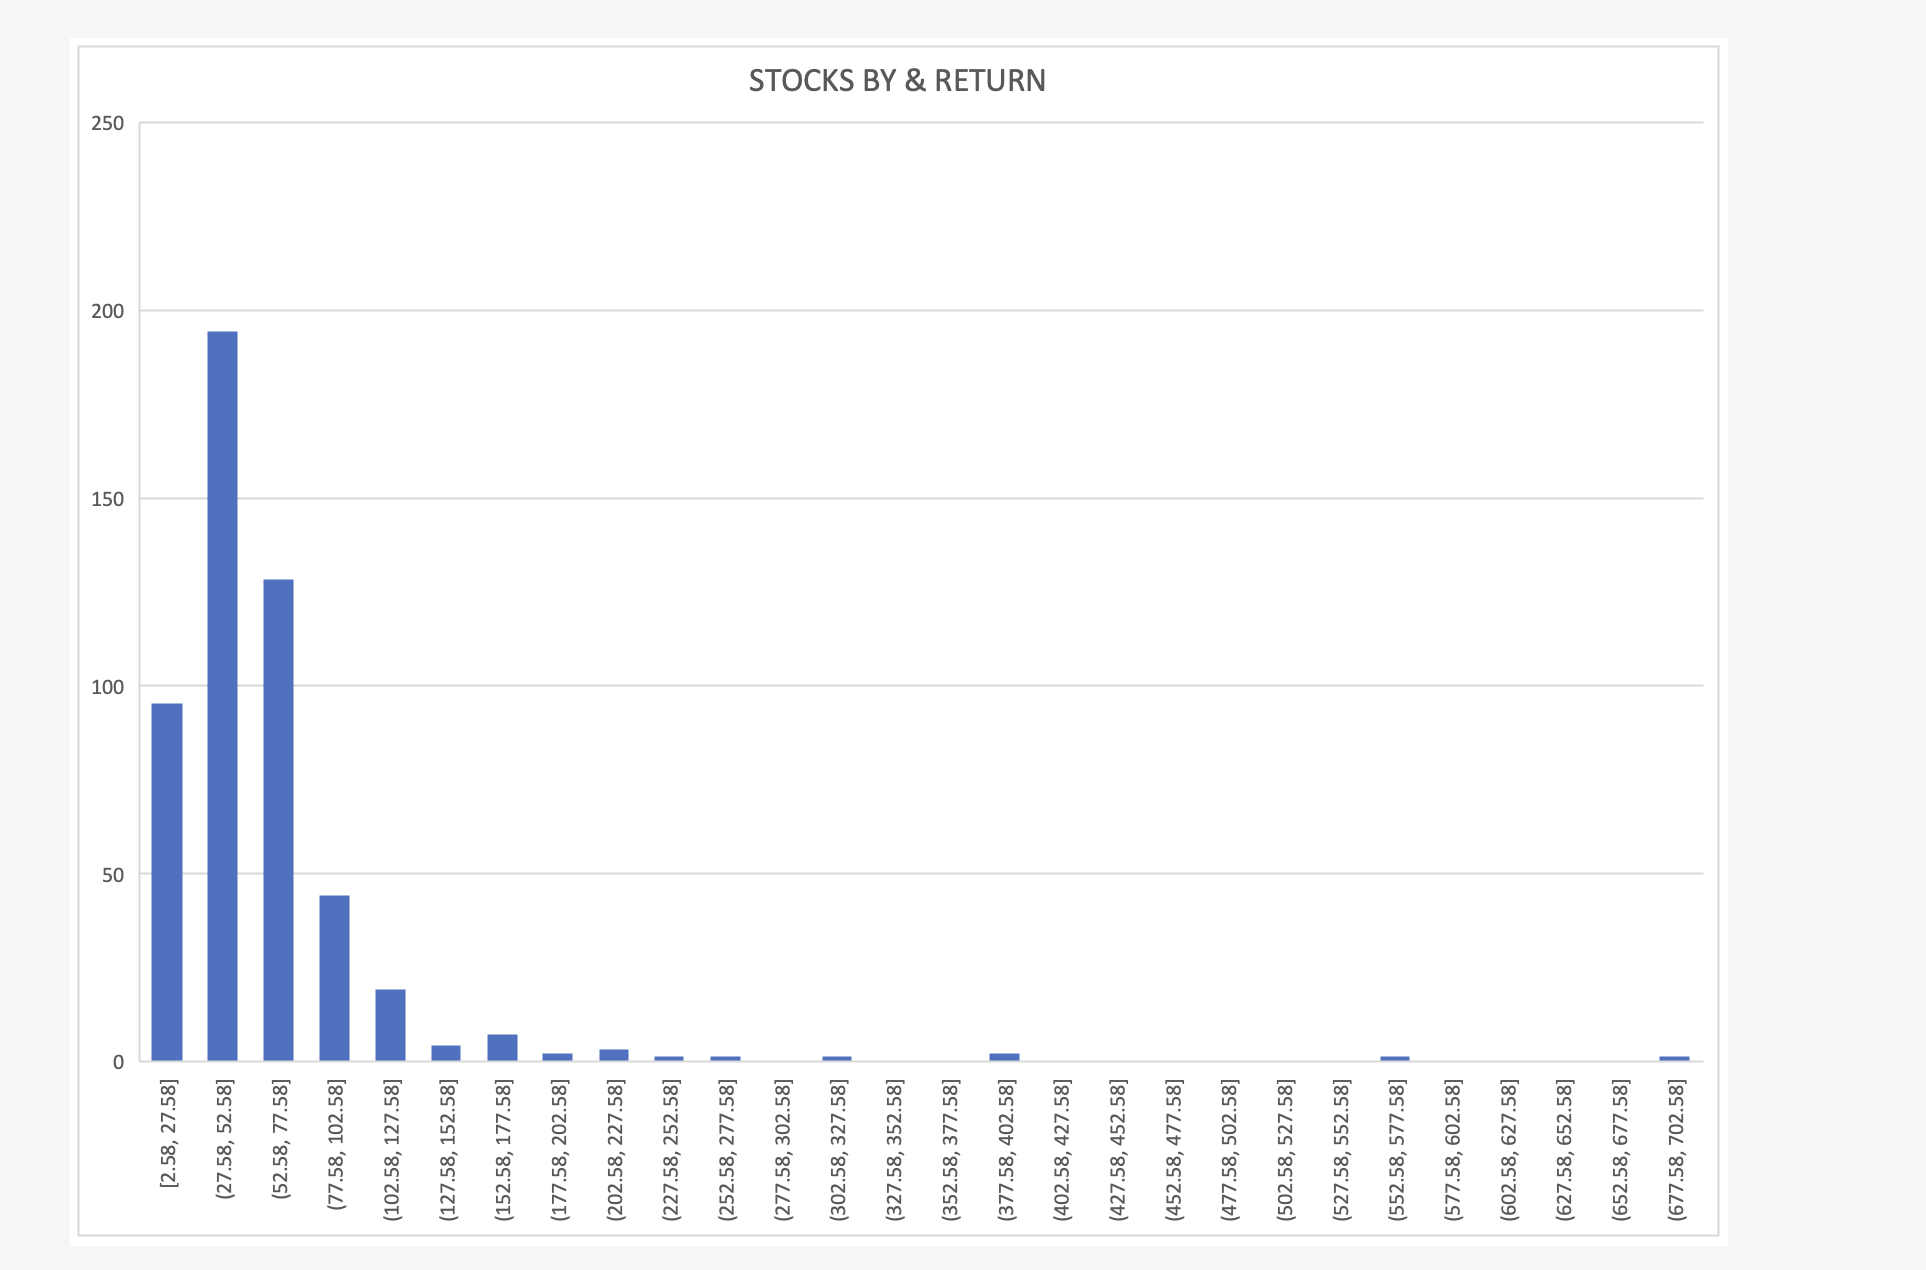
Attached is a snip of my solution to this challenge. I really liked how I got to practice different functions that I learned for the first midterm.
1 Like
I think its cool that you used different bucket groupings than the tutorial video since it presents the same data in a way that looks different!
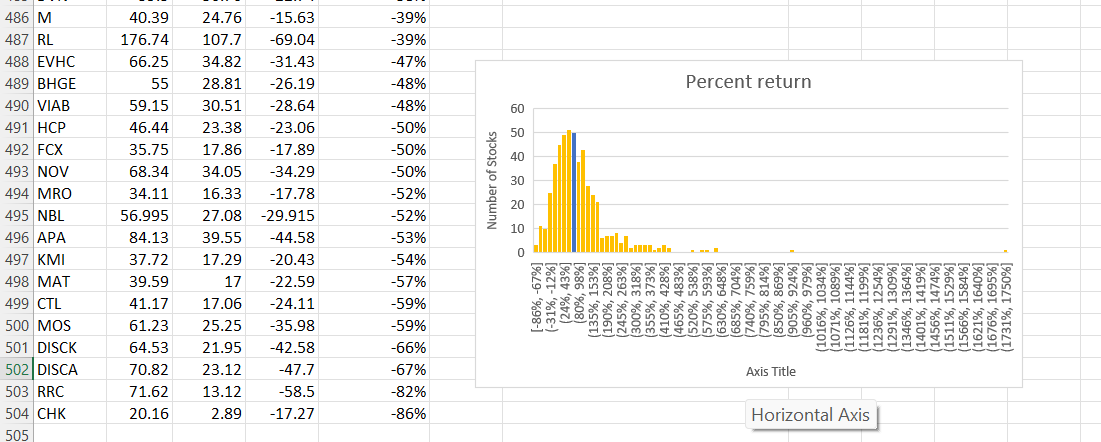
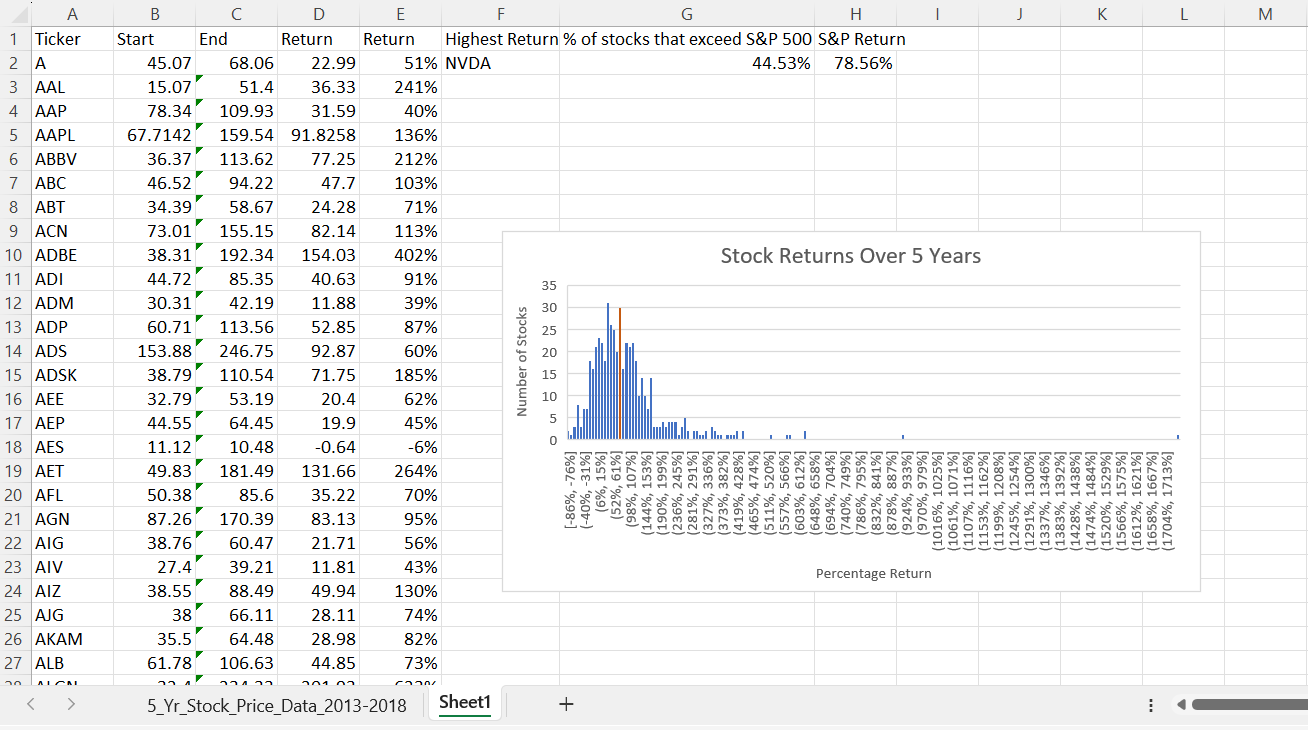
Here is my solution uploaded as a PNG because the Excel file appears to be too big: